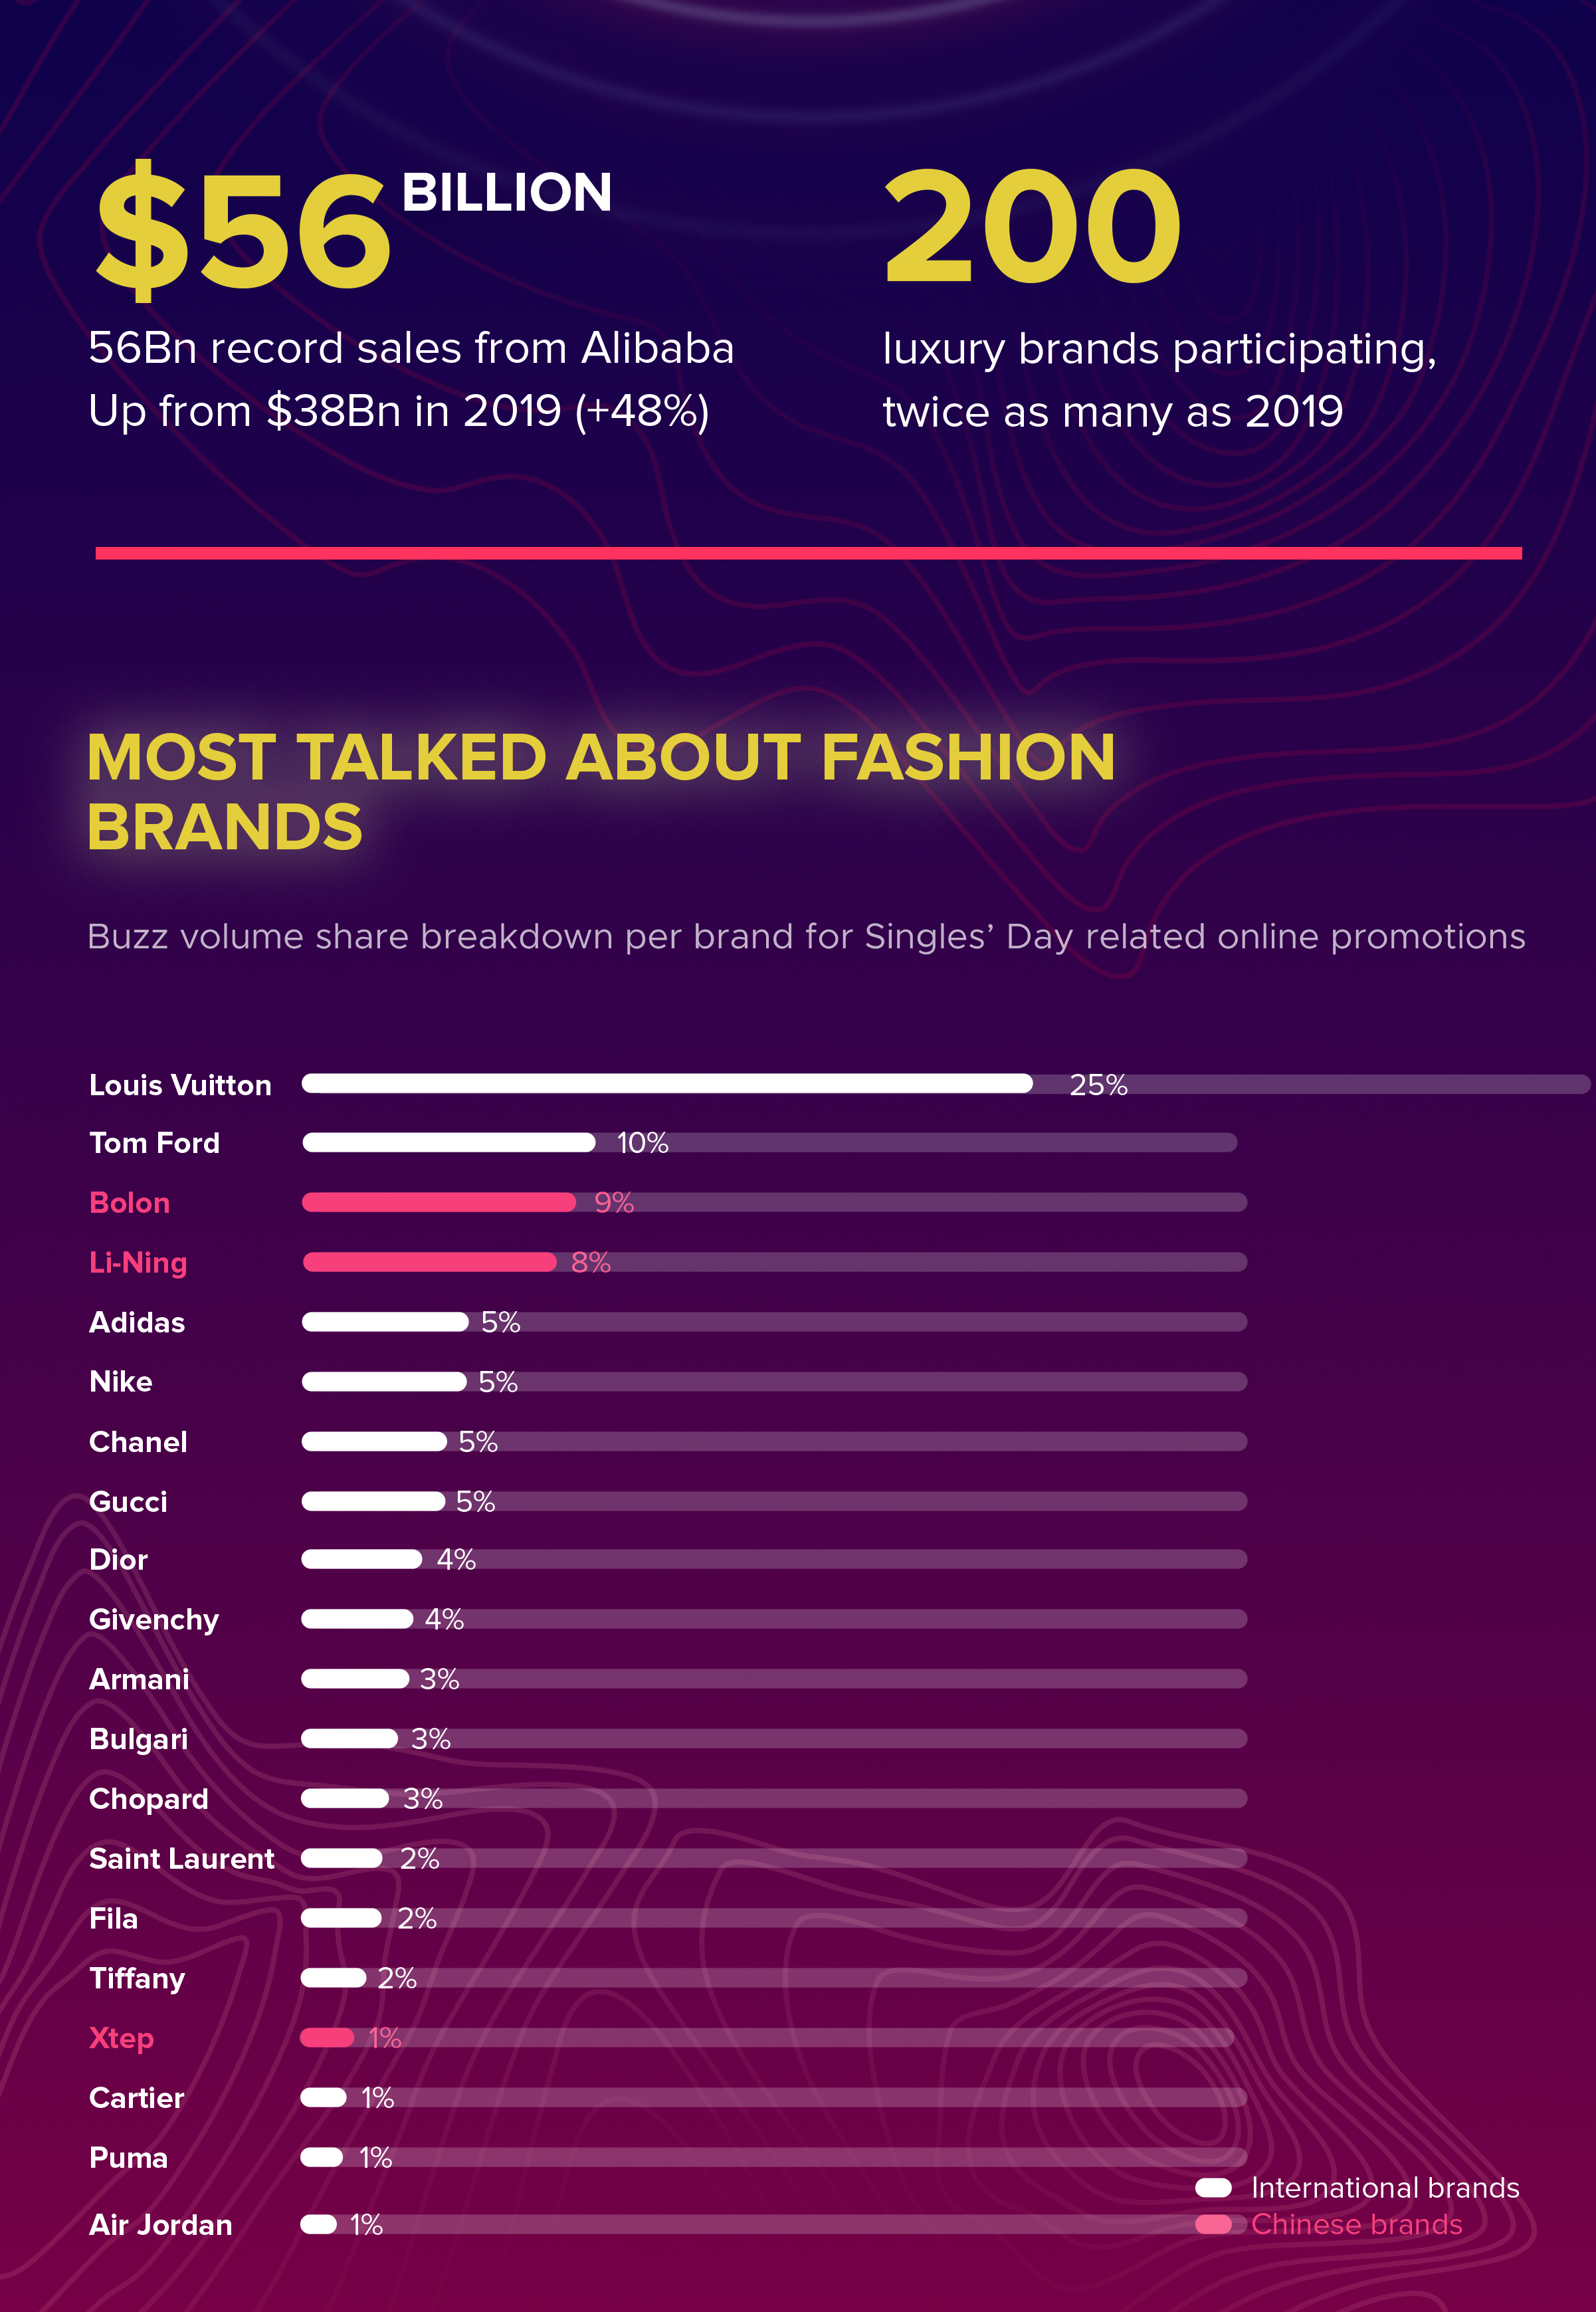
What fashion and luxury brands generate the most attention among Chinese consumers during the Singles’ Day shopping holidays? Using a buzz analysis, we were able to find out. Louis Vuitton attracts by far the most attention, but the Top 5 also includes some Chinese brands that are not well-known in the West.
China is a highly digitized society with about 900 million netizens who spend an around six hours a day on the Internet on average – mostly on domestic Chinese websites and platforms. Their online behavior in relation to brands can reveal much about the popularity of these brands in China. For instance, the attention generated by a brand relative to other brands can be determined accurately using a certain digital metric: the so-called “buzz.”
In this case, buzz consists of brand mentions in discussions on social media platforms, comment and review areas on various websites and forums. By comparing the shares that a brand holds in the overall buzz in relation to a topic such as Singles’ Day online, it is possible to calculate which brand can generate the most attention. As a rule, successful marketing campaigns or business strategies in particular catapult a brand to the top of the buzz ranking.
For the social listening analysis on the occasion of Singles’ Day, 20 fashion brands were considered which generate the most buzz on average among Chinese Internet users over the entire year. The analysis covered the first eleven days of November, including Singles’ Day on November 11, which reflects the main period for discounts and other Singles’ Day promotions. The most relevant Chinese Internet platforms were included in the analysis.
In addition, it was also investigated which Chinese e-commerce platforms, the main drivers of the shopping holidays, have the highest shares in the buzz volume. This allows us to deduce which Chinese platforms are currently the most relevant for the fashion and luxury category.
Two Chinese brands in the top 5, Louis Vuitton on top
With a 25 percent share of the total buzz volume, Louis Vuitton is the undisputed leader in the ranking of brands that were able to generate the most attention during the campaign period. Two important reasons for this success: the brand’s collaboration with the popular Chinese actor Zhu Yilong as brand ambassador and, to a lesser extent, the appointment of Virgil Abloh, for years one of the world’s most important fashion influencers and founder of the brand Off-White, as art director for the men’s collection.”In China, influencers have an even greater weight in influencing the perception of a brand than in the West,” says Lars-Alexander Mayer, Partner at TD Reply. “Across all industries, we see impressive examples of how working with Chinese influencers is helping Western brands to gain more attention in China. But it is very important to work with the right influencer. Specialized social listening tools can help here.“
Louis Vuitton is followed by Tom Ford, which opened its largest store in the world in Guangzhou, China, this October. This move was accompanied by attractive discounts during the Singles’ Day promotions and is largely responsible for the very good performance of the brand. With eyewear specialist Bolon in third place and sporting goods manufacturer Li-Ning in fourth place, two Chinese brands are also in the top five. German sports fashion giant Adidas is placed fifth, and was able to generate slightly more attention than Nike, its main competitor.
Emerging new platforms
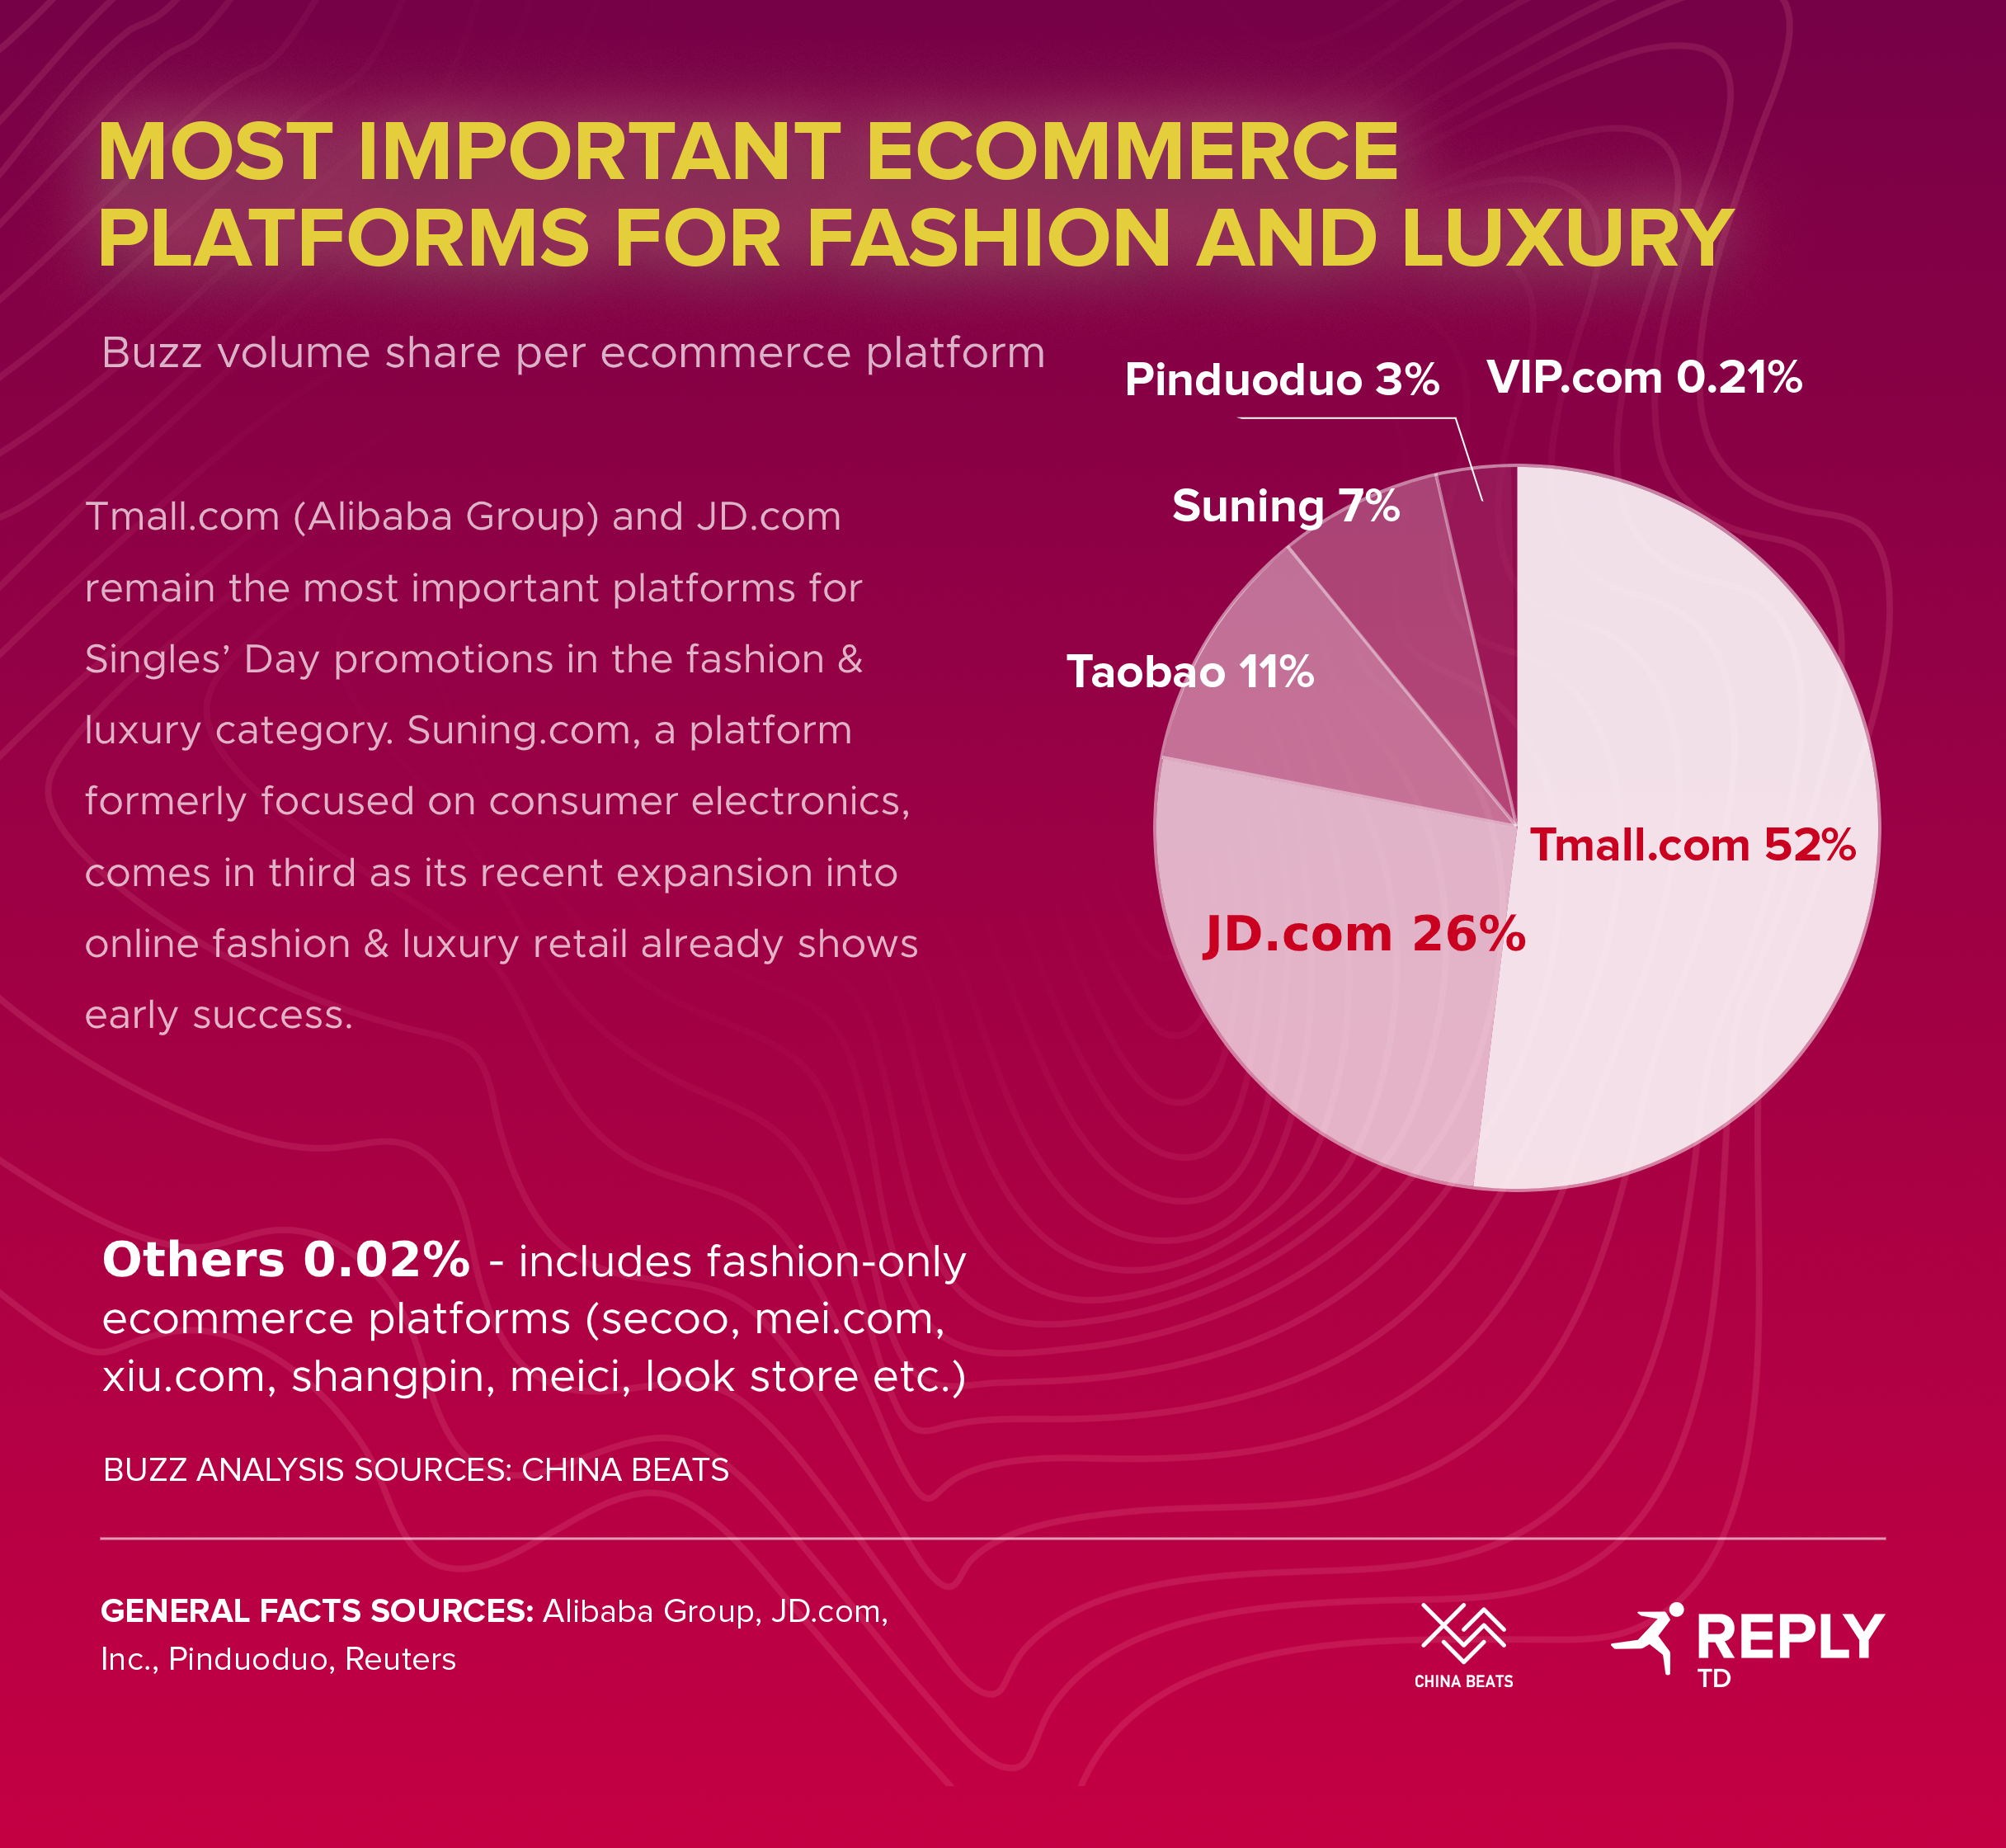
The Alibaba Group with its leading Chinese e-commerce platforms Tmall.com and Taobao is the creator of Singles’ Day as an online shopping holiday. These two platforms together account for 65 percent of total buzz volume. With a share of 52 percent, Tmall.com is by far the most relevant platform for fashion and luxury brands, followed by JD.com with a share of 26 percent.
Suning, an online and offline retailer formerly specializing in consumer electronics and a newcomer in the fashion and luxury segment, was also able to achieve a solid result of 7 percent. It was only in August this year when the company announced that it would also start selling luxury items online.
“China’s enormous platform landscape is growing continuously and we will certainly see some changes in the coming years,” says Lars-Alexander Mayer. “For Western brands, it is also important here to recognize these changes early on by tracking Chinese consumer behavior on the Internet and to exploit them to get ahead of the competition.”
In 2020, the Marketing and Advertising Industry is at a crossroads.
The past 10 years has seen more disruption than the last 100. Led by Technological innovation, the rise in importance of data, and an ever-changing cultural environment, has up ended the traditional pillars of the industry.
The next 10 years will make or break the industry.
If the industry does not take the initiative to reclaim its strengths, re-invigorate its connection to consumer culture and re-interpret the application of data it risks becoming irrelevant.
We believe the industry can and should do more to lead again.
In this report we analyse the challenges facing the industry, unpacking the key issues and disruptors, with the overall objective of providing a path forward for Marketing and Advertising.
Brand perception and loyalty among football has unique characteristics to other consumer-oriented industries, and requires special nuance and consideration. For European football clubs especially, acquiring loyal followers not only at home but also abroad is key to long-term success.
How to project a favorable, unique brand image for Football clubs?
This white paper provides insights from a range of case studies and deep-dives with our proprietary tools Digital Brand Equity (DBE) and China Beats – both industry-leading social listening tools which can be used to quantify values and trends over time.
Which markets to target?
We have answers for that as well, with special consideration of China and Indonesia. Download today and see for yourself!
The COVID-19 crisis created a dramatic shift in priorities for citizens across the world.
Brands have been uncertain about how to advertise in a sensitive way in order to not alienate consumers struggling to come to grips with the pandemic, whilst maintaining a healthy business.
Without being able to continue with “business as usual”, many brands looked to create unique COVID-19-specific campaigns.
This report looks at which campaigns resonated well creatively with consumers during the pandemic, and highlights lessons for other brands looking to restart their advertising.
This article was originally published in German in the 02/2020 edition of planung & analyse, a leading German market research publication.Click here to download the article [German].
Despite the Big Data hype, the marketing industry -made up largely of creatives and strategists- is surprisingly uncreative and often lacks strategy in its handling of digital data. When talking about digital data, the marketing industry mainly refers to tracking data used to review and optimise digital advertising spending. The potential of digital data to improve marketing effectiveness at the strategic level remains largely untouched.
However, winds are changing with the “Cookiecalypse” looming on the horizon. According to many industry experts, Google’s planned abolition of third-party cookies will significantly diminish performance marketing and tracking. In combination with increasingly strict data protection regulations, especially in Europe, the industry is being pressured to move away from gathering user-level data. Classical marketing theory and the role of brand perception will therefore become all the more important as an instrument for measuring advertising impact.
Measuring marketing effectiveness holistically
The forward-looking, exploratory, and strategic potential of digital data can be fully unearthed in this post-cookie era. This opens up new perspectives for campaign optimization, brand management and other strategic decision-making processes. Some innovative companies are already paving the way today, having successfully implemented many of these approaches.
One such approach is Marketing Effect Modelling, a hybrid approach that combines proven econometric methods and consumer behavior theories with modern data analytics and machine learning. This is the only customer-proven approach to date that allows marketing ROIs to be calculated and tracked by channels in real time. Using the same principles, it enables the calculation and continuous tracking of brand value from millions of online comments. But how does it work?
The web as a digital soundbox
Marketing Effect Modelling is based on the theoretical foundation of the ‘Digital Soundbox’ – which assumes that the boundaries between offline and online worlds have become blurred. Prior to the wide use of the internet, the real world was a closed space with actions and their effects remaining solely in that space. The arrival of the internet offered a connection to another space, the digital space, in which our activities reverberate in the form of digital data. Virtually everything we do in the real world today leaves digital traces, which can be measured and analyzed in order to gain new insights.
Take the COVID-19 crisis in Germany for example. In the initial phase, the behavior of the population was marked by fear and worry, which in turn was strongly reflected in Google search behavior. Unsurprisingly, the number of searches related to symptoms of COVID-19 increased sharply. As time went on however, the mood stabilized – people came to terms with the situation and wanted to make the most of the lockdowns across Europe. From then on, searches for prevention pathways, home office equipment and digital learning content increased.
Missing link between spendings and sales
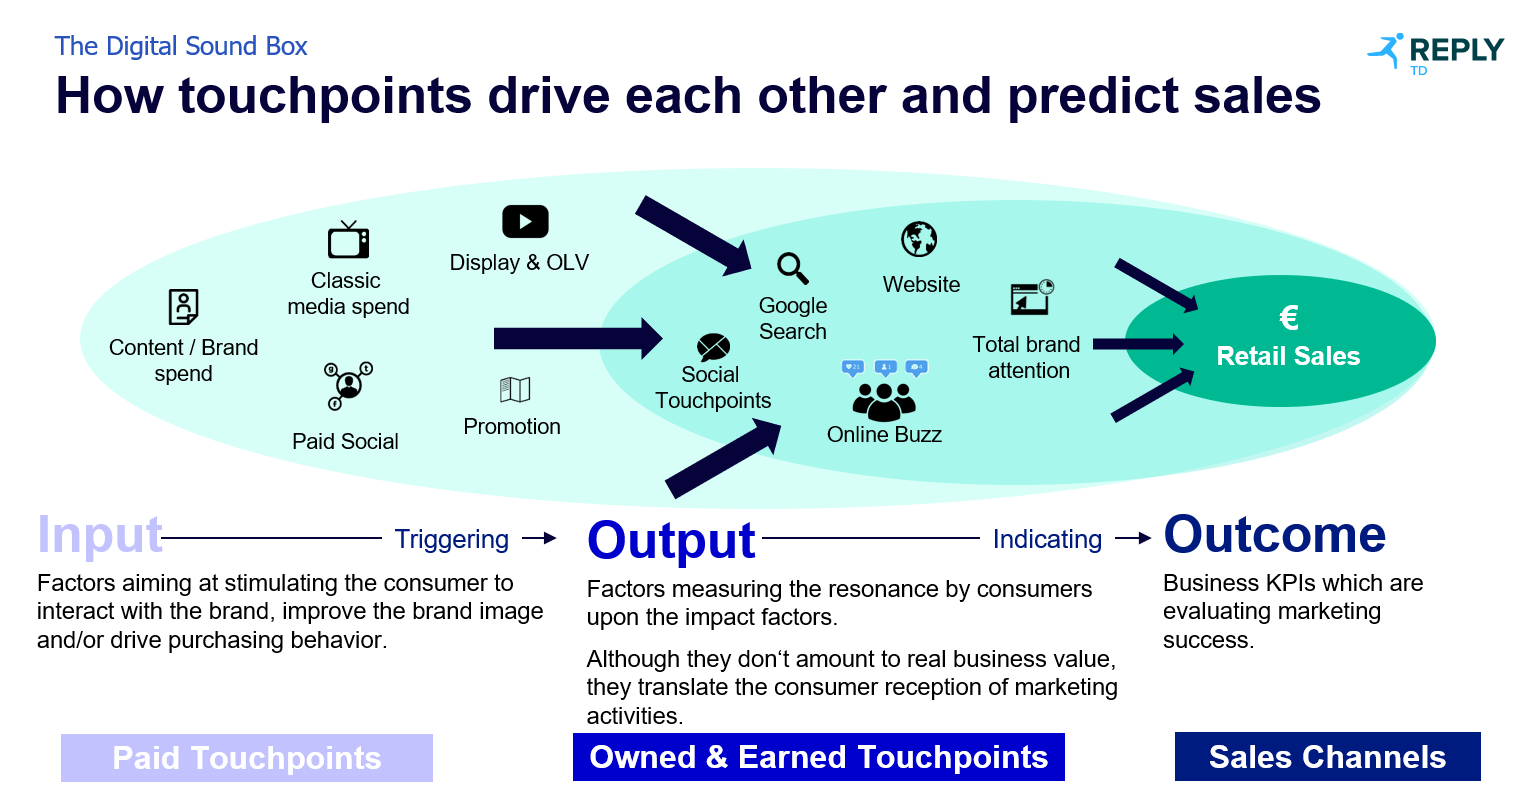
Of course, Google searches are only one part of the digital data universe. Every type of digital output generated by consumers is part of the ‘Digital Soundbox,’ including online buzz (relevant comments and mentions on social media and other platforms), website visits, store visits and even tracking the number of call center calls.
In Marketing Effect Modelling, digital data (output) acts as a link between marketing expenditure (input) to sales and revenue (outcome). Where there was a gap once, there is now measurable data. Only the right algorithms are missing to evaluate this data in real time and get answers (see Figure 1).
Classic statistics paired with real-time metrics
So much for the theory. In practice, Marketing Effect Modelling consists of two components. The first component is regression analysis, which is also used in more traditional marketing mix models. In order for the statistics to lead to a clear overall result, it ideally needs at least two years of media and sales data. Regression analyses are already used to create reliable cross-channel marketing mix models, providing an average ROI per marketing measure. The problem however is that is only tracked retrospectively- in other words, they cannot determine the ROI in the here and now. In addition, these models are often cost-intensive, so in practice it may only be carried out once every two years. What happens in the two years between the last and the next analysis in that case remains a black box.
This is where the second component of Marketing Effect Modelling begins: real-time metrics. These are determined by a correlation analysis based on digital data that most accurately precedes the performance-critical business KPIs and has the highest explanation for sales. Often this includes Google searches and online buzz, which have been shown to have a significant statistical impact on sales.
Real-time metrics are continuously calculated and tracked on a daily basis against past averages to determine a “Live ROI” value for all campaigns across all channels (digital and non-digital). All the while, machine learning algorithms work in the background to produce the Live ROI score, which consists of both measured and of predicted values at a fifty-fifty split. The predicted values close the gaps in which the system is fed with updated sales data, which typically happens monthly in practice. The algorithms are trained with each update and thus become more accurate over time.
Dashboard as command deck
Dashboards play a central roll in making the Live ROI user-friendly. As data flows in the backend, all relevant key figures including the Live ROI are visualized on the front end. Marketing Effect Modelling requires a dashboard that is as flexible as possible and supports the connection of various internal and external data sources. That’s why we at TD Reply like to use our in-house dashboard solution called Pulse, which has the capability to support the integration of other dashboard solutions as well.
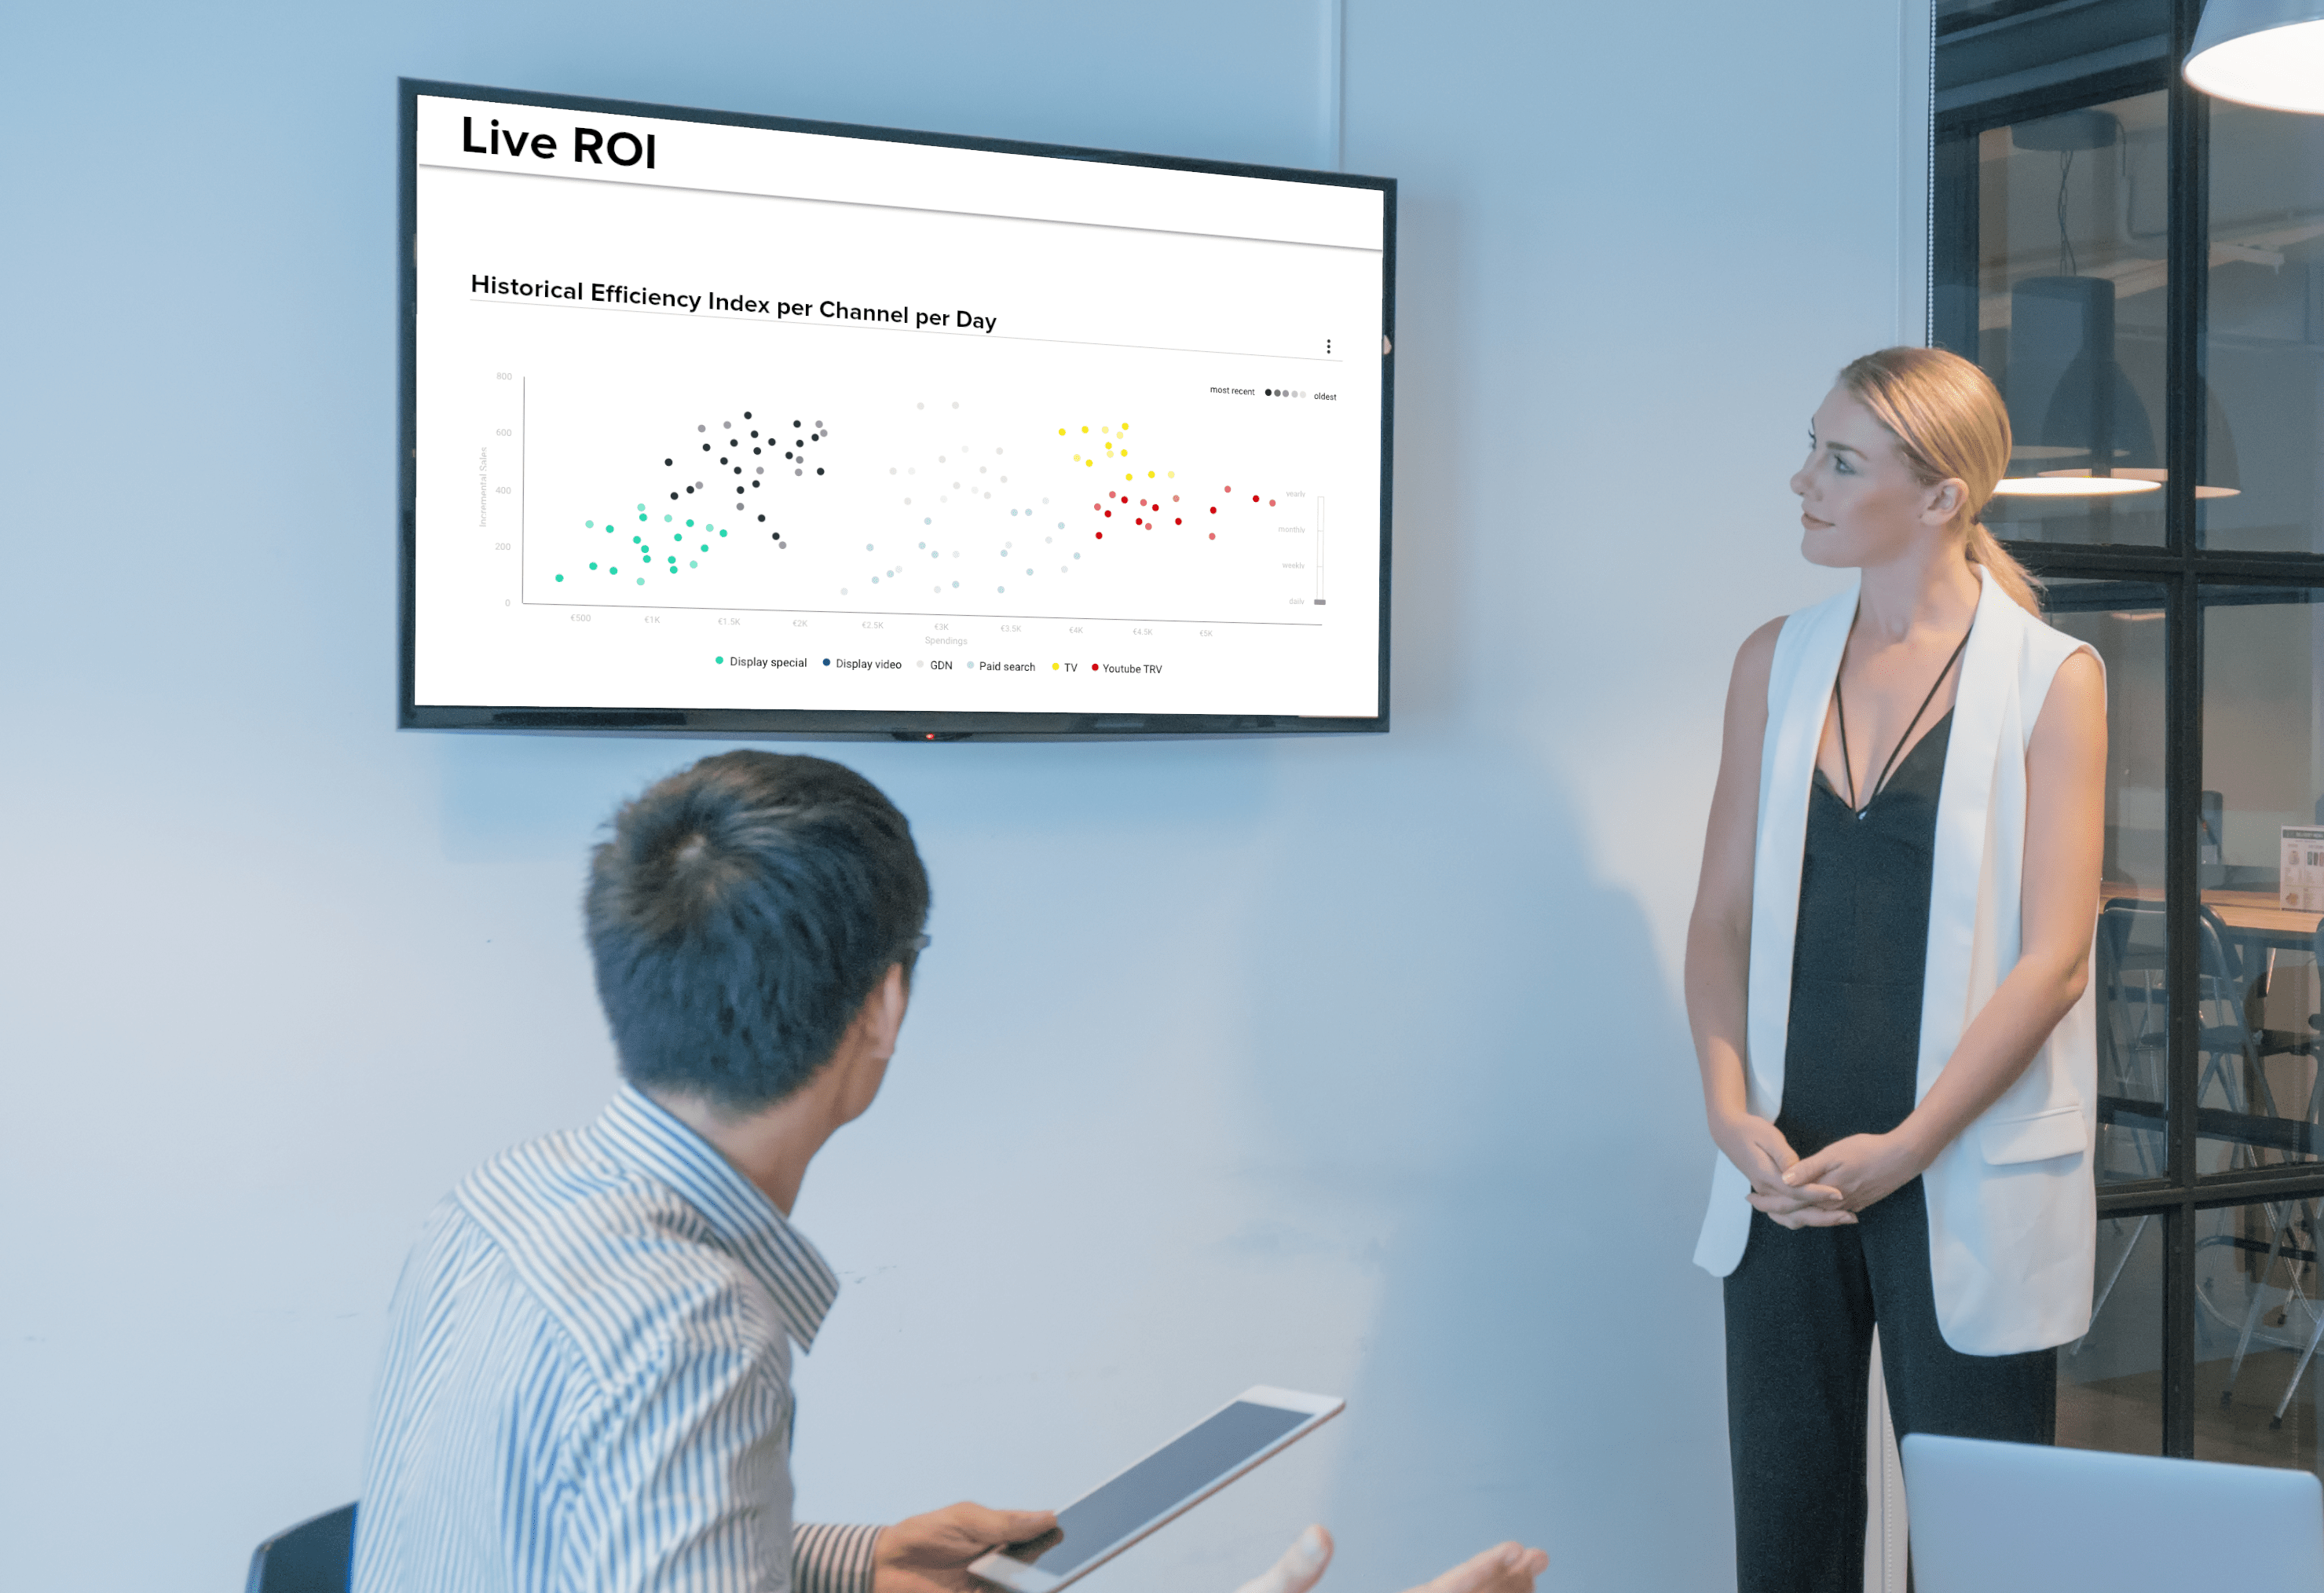
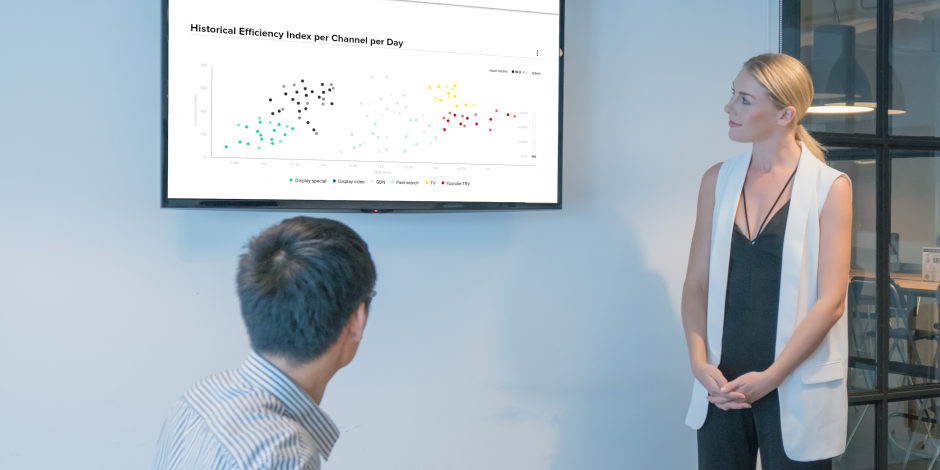
The dashboard serves as a control center for campaign managers from the corporate and agency side- measuring the effect of their marketing activities on channel, campaigns and even asset levels with the Live ROI at any time in real time; thus optimizing their media spending “on the fly”. For example, users can immediately see on the dashboard if a channel is under- or over-performing (see Graph 2), allowing investments to be reduced to underperforming channels and vice versa. This results in significant cost savings, removing blind intervals in which those responsible are unaware whether their campaigns are performing with the desired effects. A well-known customer was able to quadruple its video ROI within one year with the help of this control center effect. In the end, the healthy ROI and sales uplift was more than twenty percent.
Cross-channel, real-time tracking can also isolate the effect of individual campaigns and related actions while they are still running – solving one of the age-old mammoth problems in marketing, namely the relative inability to act during the active duration of the campaign, via the Digital Soundbox. At the same time, live ROI tracking immediately addresses an ex-post analysis and can be used to draw important lessons for future campaigns, even after the campaign ends: What worked well when, what didn’t, and why?
Dynamic brand control
By tracking online buzz, Marketing Effect Modelling also allows for determining the so-called ‘Digital Brand Equity.’ This enables medium- and long-term brand control in addition to the potential of Live ROI for short-term campaign optimizations.
Digital Brand Equity is an associative approach to determining brand value, inspired by behavioral scientist Jennifer Aaker’s brand-personality model. A set of brand personality attributes such as “reliable” or “safe” is first defined, according to Aaker, then online buzz is analyzed using algorithms to determine which personality attributes are particularly pronounced in the brand.
The algorithm calculates this by focusing on the semantics and tonality in the comments and measuring the “fit” with the predefined personality attributes. Depending on the brand and campaign, up to several million comments could be analyzed in this way. The Pulse dashboard’s visualization capabilities then create a brand association wheel that paints a clear picture of consumers’ perception of the brand value (see Chart 3). Similar to Live ROI, Digital Brand Equity can be continuously tracked to see how individual measures affect brand value, which gives marketers a strong starting point for long-term brand management as well as better brand positioning.
Time for a reset
In tandem, these characteristics ultimately create new levers for the holistic control of marketing effectiveness Their hybrid character makes it possible: they combine classic marketing theory with the latest data technologies.
Unfortunately, the mainstream marketing industry is taking a different approach to digital data. A quick glance at job advertisements for digital marketer is enough to convince yourself; they often only ask for tool skills instead of theoretical knowledge.
Today, with the end of cookies on the horizon and the ever-accelerating speed of business, the time has come to rethink the fundamentals. Put boldly, Alan Murray, CEO of Fortune Media has claimed: “The crisis does not require companies to restart, but to reset.”
In economic terms, the COVID-19 crisis may be the single biggest challenge for Europe in the postwar era. Like any major crisis, it also brings with itself immediate and long-term changes. To emerge strongly from the crisis, businesses need to be able to adapt quickly to these changes.
Which industries were more affected than others why? How should brands in various sectors communicate during and after the crisis? In how far have the consumer perceptions shifted?
The new, continuously expanding, and data-driven Reply COVID-19 impact report series brings some light into the dark.
All of the reports were produced with the help of TD Reply’s arsenal of innovative research and analysis tools. Among others: China Beats, the consumer intelligence platform that helps Western businesses to understand China; SONAR, the unique data-driven trend radar, and last but not least Quentin, our internal search volume analyzer.
This article was originally published on The Drum on March 16, 2020.
With the end of cookie-based user journey tracking looming on the horizon, interest in marketing theory and methods from the pre-attribution era is on the rise again.
This is bad news for the many ad tech providers who rely on cookie-based data, but good news for the marketing industry. After ten years of steady hype, attribution modelling, including multi-touch attribution, has never proven to be the sure-fire way of increasing marketing effectiveness it promised to be. It is this increasingly widespread realization that got the stone rolling in the first place. Tightening GDPR cookie consent regulations and Google’s announcement of plans to kill third-party cookies by 2020 are only accelerating their decline. A few months ago, Adidas stated that its attribution models tended to produce erroneous results such as suggesting that performance advertising is the principle driver of e-commerce sales. Through econometrics, Adidas eventually discovered that the role of video and other brand-centered activities had been vastly underestimated.
Ironically, what was once purported to be the core benefit of attribution models – the individual customer journey tracking – now turns out to be their pitfall. Apart from legitimate questions about privacy (harming the industry’s reputation in the process), using person-level data can be a misleading basis for making marketing decisions. This is especially true for industries like automotive and CPG, in which decision-making is complex, brand equity plays a key role and offline channels account for a majority of sales.
Single-user tracking can distract from the big picture
In contrast, individual journeys have never played any role in the econometric methods such as marketing mix modelling, which are now experiencing a major comeback. They are all about producing generalisable answers from generalised data and creating a time series that clearly links marketing activities to sales. Done right, marketing mix modelling provides an accurate estimation of the real impact of past and future marketing activities.
Of course, marketing mix modeling faces limitations of its own. First of all, it is expensive and very time-consuming. Moreover, to be accurate, it needs at least two years of historical data. This explains why even many big companies can only afford to conduct marketing mix modelling in two- to three-year intervals. Perhaps most disadvantageously, however, classical marketing mix models have no real-time relevance. For instance, marketers may discover through marketing mix modelling that one channel is underperforming, so they will lower investments and shift budgets to better-performing channels. But the actual effects of these actions are obscure until the next round of marketing mix modelling is completed, which can be several years later. Accordingly, companies are not able to amend their course of action on an ongoing basis, making the method unsuitable for steering purposes. Moreover, the effect of activations and channels with comparably little invest – which disproportionally includes digital activations – is very hard to measure. In a nutshell, traditional marketing mix models are unfit to benefit from the real-time availability of digital data and the newly won ability to optimize activations on short notice.
The best of both Worlds: Towards Marketing Effect Modelling
Marketing mix modelling as we know it has existed for at least 30 years. Innovative thinking and contemporary technology can fix many of its problems. Based on this premise, we created the marketing effect modelling approach, which we regard to be the next step in combining the bird’s eye view of marketing mix models with the real-time, behavior-based nature of digital data. The idea is simple enough: To the standard linear regression analysis, which establishes a historical baseline, we add the component of live metrics.
First, data that is available on a daily basis and derived from the company’s KPI’s are added to the mix. Virtually anything that fits the bill can be incorporated, from Google searches to store visits or even the number of calls arriving at a call center. The model then uses machine learning algorithms to fill the existing data gaps by enhancing the daily values with predicted hourly values. This way, we obtain live metrics that have proved to be highly accurate in our work with leading FMCG clients. As a result, what we get is essentially a continuous, real-time system that delivers all the benefits of marketing mix modelling without its drawbacks. Moreover, digital metrics allow us to measure organic consumer interest in brands, products and campaigns, factors that are often neglected when analyzing media effectiveness. Ultimately, paid media investments are only a small part of the equation, and digital metrics can improve our understanding of many other contributing factors, including brand strength and external consumer trends.
For the first time, marketers are able to track their marketing ROI in real-time and across channels without having to rely on personal-level data. The ability to continuously monitor how well a channel is performing saves cost on advertising that doesn’t deliver value and maximizes the impact of the invested budgets.
Exciting times for the industry
Econometrics also brings with itself a shift in focus towards marketing theory once again, the good old 4Ps. As Drum reporters McCarthy and Blustein point out, we are going to see “a return to brand awareness and direct response campaigns” as well as “to the traditional cornerstones of advertising where every movement and action of the consumer isn’t attributed to a single ad.” This is good news – both for the marketing industry, large advertisers and the consumers.
Given the benefits, we expect to see a proliferation of similar approaches building upon classic marketing mix modelling with new technologies in the coming years. Over time, they will become more affordable for small and medium-sized businesses too. It will be interesting to see how not only media planners, but also strategists and creative planners make use of these new opportunities.
Dozens of COVID-19 dashboards have emerged over the past three months, allowing us to track the progression of the pandemic from the safety of our homes. Some of them, such as John Hopkins University’s dashboard, have seen widespread usage in news reporting and social media posts and reached almost an iconic status.
So far, however, all well-known dashboards are essentially aggregating data. They are not interpreting data in any way that goes beyond mere data visualization. We at TD Reply asked ourselves: “Wouldn’t it be interesting to apply predictive analytics models to the COVID-19 case data in order look into the future and predict what will happen in the next two or four weeks?” A COVID-19 dashboard powered by predictive analytics could provide, at the minimum, a tangible timeframe to understand when COVID-19 will begin to flatten, which could then be investigated further.
Moreover, we believe that predictive models will play a key role in making better political and business-related strategic decisions. Yet currently, there is a limited exchange between predictive analytics experts from different businesses, academic and other institutions. In fact, many experts are hesitant to publish their models as they are not confident about accuracy. But there is no expert exchange to make predictive models better. We believe that creating and sharing a COVID-19 dashboard with predictive capabilitieshelps to contribute to an expert discourse on the role of predictive models today and beyond.
We are proud of presenting the result, 100% home office created using Pulse, our flexible dashboard builder: the COVID-19 Data Analytics (CDA) dashboard.
COVID-19 case data by the WHO and the leading German institute for disease control and prevention, the Robert Koch Insitute has been used as the main data source. On the model side, our data scientists have used models from the exponential family based on SIRS models. Additional extrapolations account for important events. The dashboard supports predictions for six countries: France, Germany, Italy, Spain, the UK and the US.
Getting started with the dashboard is easy and you will find additional information within the dashboard itself.
The most important first step is to set the filters according to your own preferences. Here you have the choice between countries and three model scenarios: optimistic, pessimistic, and expected. The latter model is selected by default and represents a middle ground between optimistic and pessimistic scenarios that has, so far, provided accurate results.
Our newest trend report takes a close look into the rapidly developing area of Autonomous Things (AT). Using our proprietary data-driven trend research tool SONAR, we mapped all relevant trends related to AT and created a trend hype-cycle that allows us to see what the booming and upcoming AT trends are.
Among other things. we found that while autonomous smart home devices are already ubiquitous, autonomous vehicles and robo-taxis are still in the “niche trend” quadrant, meaning that we will not see a large-scale adaptation of these technologies in the next few years to come. However, we expect the number of autonomous mobile robots to rise from the current 20.000 units shipped globally to 350.000 by 2022.
We also identified key players in the Autonomous Things area that often fly under the radar of mass media coverage.